Revenue Results
The Revenue Results page provides a detailed breakdown of the revenue associated for the selected simulation. The table may vary based on the selected Application or Energy Market.
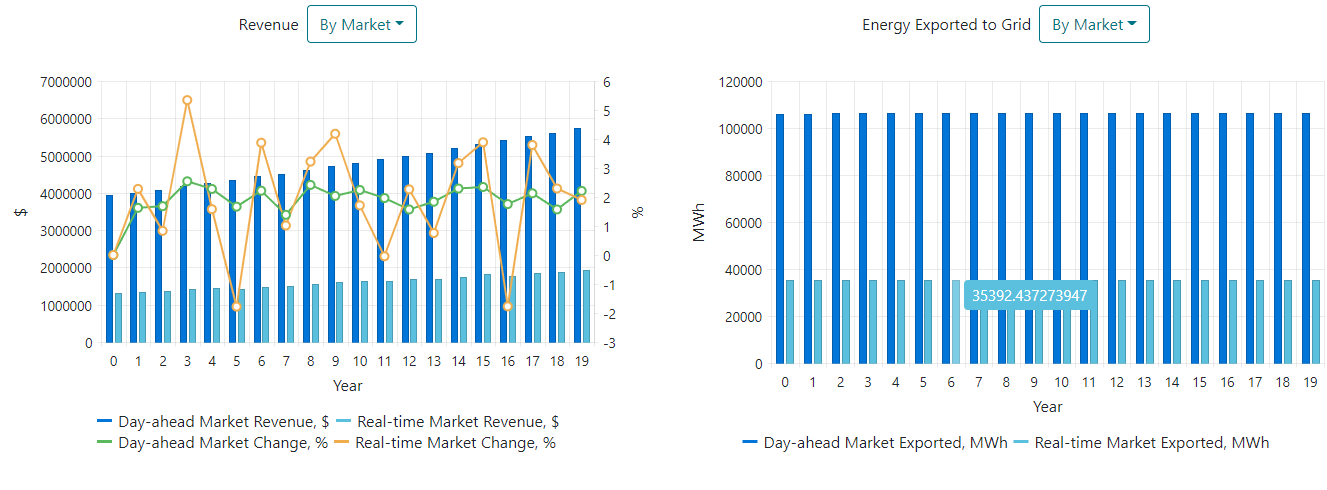
Left chart: Revenue results by Market, Right Chart: Energy Exported to Grid by Market
| Variable | Description |
|---|---|
| Minimum and maximum usable energy capacity | Revenue is the sum of revenue from the specific application or market |
| Storage energy input and output | Annual change in revenue, compared to the previous year |
| Cycle cost | Energy exported: total energy sold from a given energy market |
| State of Charge Percentile | Average price realized: Sum of income from a market ($) / Energy exports (MWh) |
| Augmentation | Annual change in price, compared to the previous year |
| Operating expenses | Operating expenses are the sum of operating costs related to storage, including the storage dedicated converter operating costs, but excluding replacement or augmentation costs |
| Equivalent cycles | Equivalent cycles is the annual throughput divided by the storage nameplate capacity |
| Operating cost | Operating cost is the sum of equipment cost, excluding replacement costs |